Reset Windows Password: System Resource Usage Monitor
The System Resource Usage Monitor (SRUM) appeared with Windows 8 as an integrated part of the Diagnostic Policy Service. The SRUM is an underestimated, but an important artifact of forensic investigation. It can tell what was happening on a computer at a certain point in time. SRUM stores (usually for the last couple of months) per-minute traces of user and process activity, statistics on sent and received data over the network, some extended and exhaustive information on using processor time, mouse, keyboard, disk, and so on.
Physically, all the data collected by SRUM are stored in %WINDIR%\System32\sru\SRUMDB.dat file. This file is in fact an Extensible Storage Engine database, the same format Microsoft uses to handle information in Active Directory, Windows Search, Windows Mail, etc.
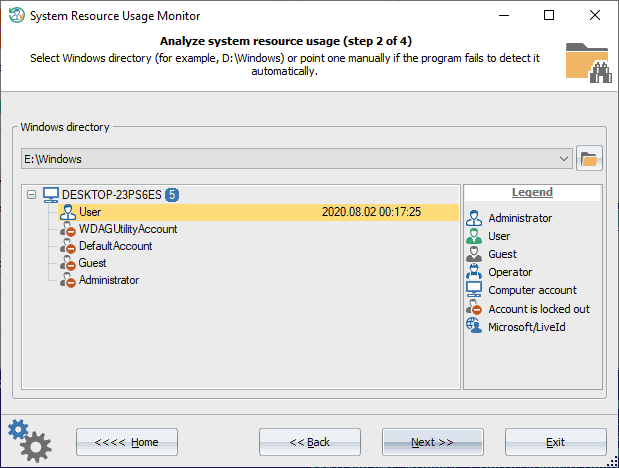
Selecting the OS directory

To parse and analyze the data from the SRUM database, provide the path to the Windows directory first.
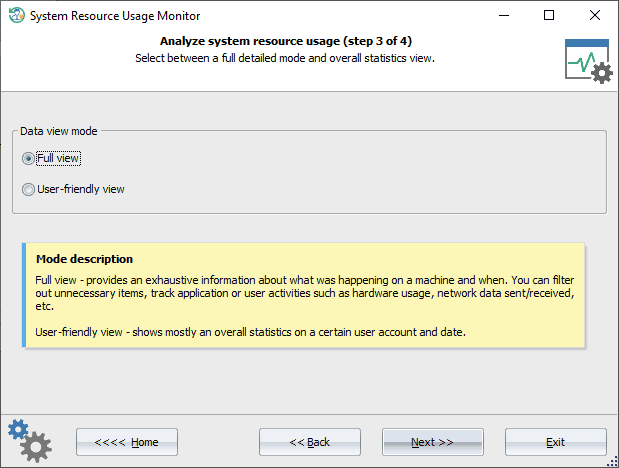
Selecting view mode

You can use two modes for displaying the data. The full view mode displays all available information about system resource usage. You can filter out unnecessary items (f.e. user account or date), track application and user activities such as software and hardware usage, network data sent\received, CPU cycle utilization, metrics for I/O operations, etc. The short mode hides some redundant information and shows general statistics on users for a certain time period.
SRUM full view

Most data live in the following tables:
- Application timeline
- Resource usage
- Network connectivity
- Network data usage
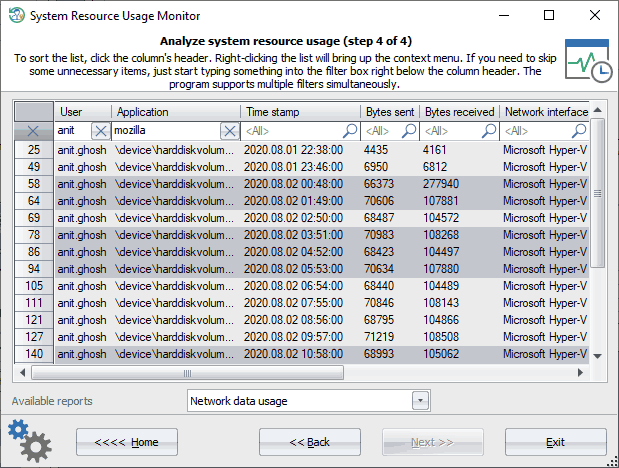
Sample task. Find out when and how many bytes were received and sent from within the Firefox browser by anit.ghosh user account.
Sample solution. Let's type in into the username filter the following string 'annet.ghosh', and into the application filter - 'Mozilla' or 'Firefox'. So we should get the timeline statistics for our user, as shown in the picture above.
Data shared to all tables: user account, application name, the date and time the data was recorded into the database.
Data available in 'Application timeline' report: CPU timeline, CPU cycles, cycles breakdown, cycles attribute, cycles attribute breakdown, cycles WOB, cycles WOB breakdown, disk timeline, disk raw, network timeline, network tail raw, network bytes raw, metered network timeline, metered network tail raw, metered network bytes raw, rendered timeline, rendered, dirtied timeline, dirtied, propagated timeline, propagated, display required timeline, display required, in focus, user input timeline, user input, keyboard input timeline, keyboard input, mouse input, audio in timeline, audio in, audio out timeline, audio out, PSM foreground, flags, end time, timeline end, duration, span.
Data available in 'Resource usage' report: face time, foreground cycle time, foreground bytes read, foreground bytes write, foreground context switches, foreground number of flushes, foreground read operations, foreground write operations, background cycle time, background bytes read, background bytes write, background context switches, background number of flushes, background read operations, background write operations.
Data available in 'Windows push notifications' report: notification type, network type, payload size.
Data available in 'Network connectivity' report: connection started, connection time, network interface, interface type, profile ID, profile flags.
Data available in 'Network data usage' report: bytes sent, bytes received, network interface, interface type, profile ID, profile flags.
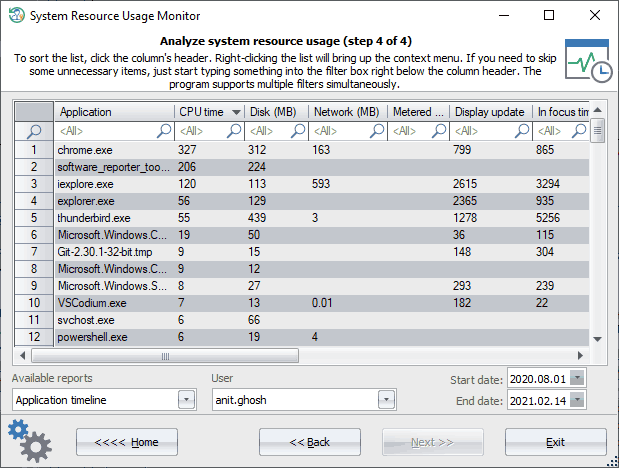
SRUM user-friendly view

General statistics for a specific user by a date frame.

